Pipe Fittings Weight Chart in Kg & MM – Complete Size-Wise Reference Guide
February 3, 2026
Flanges Weight Chart: Complete Guide for Accurate Piping Design and Industrial Use
February 4, 2026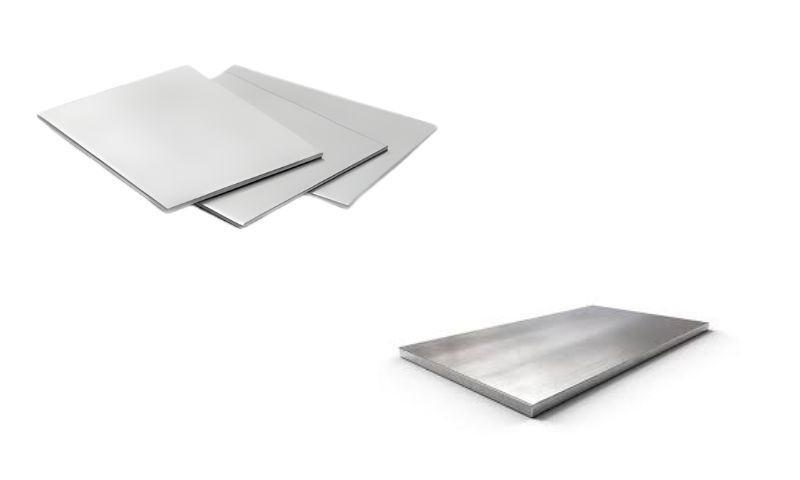
Precision is all in industrial manufacturing, construction, and fabrication. The Sheets and Plates Weight Chart is one of the most valuable sources that will be utilized by engineers, procurement teams and project planners. This chart allows the industries to estimate load, cost and handling requirements with certainty because it gives accurate weight calculations depending on the material type, thickness, width, and length. Regardless of the type of materials, stainless steel, carbon steel, aluminum or alloy, a good weight chart will help to carry out the project smoothly and reduce the chances of errors concerning materials.
Sheets and Plates Weight Chart is a crucial tool used in the industrial supply chain of B2B business, including bulk material purchase, inventory control, and optimization of logistics in the manufacturers, fabricators, and infrastructure developers. Even trifling errors in calculations in large-scale projects can result into cost overruns or delays thus, standardized weight charts are a must-have technical reference to business buyers and industrial decision-makers.
What Is a Sheets and Plates weight Chart?
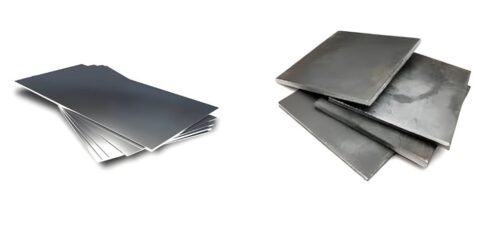
A Sheets and Plates weight chart is a tabular reference list that shows the theoretical weight of a sheet and plates of metal in accordance with a set of standard formulae. Material density and volume are usually multiplied to obtain the weight. The chart is variable because various metals are of different densities and therefore the chart is determined by the grade and specification of a material. Such charts are prevalent in the case of stainless steel sheets, mild steel plates, aluminum sheets and special alloy plates.
The chart usually contains such parameters as thickness (in mm), width, length and the weight per sheet or per square meter. Using this information, the professionals may estimate the weight of shipments, lifting needs and storage needs easily in a short period without having to carry out manual calculations many times.
SS Sheets Weight Chart
| THICKNESS IN MM | SIZE IN MM | WEIGHT KG/M2 | ||
| 2000 X 1000 | 2500 X 1250 | 3000 X 1500 | ||
| 0.18 | 2.88 | – | – | 1.44 |
| 0.20 | 3.20 | – | – | 1.60 |
| 0.22 | 3.52 | – | – | 1.76 |
| 0.24 | 3.84 | – | – | 1.92 |
| 0.27 | 4.32 | – | – | 2.16 |
| 0.28 | 4.48 | – | – | 2.24 |
| 0.32 | 5.12 | – | – | 2.56 |
| 0.38 | 6.08 | – | – | 3.04 |
| 0.44 | 7.04 | 11.00 | – | 3.52 |
| 0.50 | 8.00 | 12.50 | – | 4.00 |
| 0.56 | 8.96 | 14.00 | – | 4.48 |
| 0.63 | 10.08 | 15.75 | – | 5.04 |
| 0.75 | 12.00 | 18.75 | – | 6.00 |
| 0.88 | 14.08 | 22.00 | – | 7.04 |
| 1.00 | 16.00 | 25.00 | 36.00 | 8.00 |
| .1.13 | 18.08 | 28.25 | 40.00 | 9.04 |
| 1.25 | 20.00 | 31.25 | 45.00 | 10.00 |
| 1.38 | 22.03 | 34.50 | 50.00 | 72.00 |
| 1.50 | 24.00 | 37.50 | 54.00 | 12.00 |
| 1.75 | 28.00 | 43.75 | 63.00 | 14.00 |
| 2.00 | 32.00 | 50.00 | 72.00 | 16.00 |
| 2.25 | 36.00 | 56.25 | 81.00 | 18.00 |
| 2.50 | 40.00 | 62.50 | 90.00 | 20.00 |
| 2.75 | 44.00 | 68.75 | 99.00 | 22.00 |
| 3.00 | 48.00 | 75.00 | 108.00 | 24.00 |
| 3.25 | 52.00 | 81.25 | 117.00 | 26.00 |
| 3.50 | 56.00 | 87.50 | 126.00 | 28.00 |
| 3.75 | 60.00 | 93.75 | 135.00 | 30.00 |
| 4.00 | 64.00 | 100.00 | 144.00 | 32.00 |
| 4.25 | 68.00 | 106.25 | 153.00 | 34.00 |
| 4.50 | 72.00 | 112.50 | 162.00 | 36.00 |
| 5.00 | 80.00 | 125.00 | 180.00 | 40.00 |
| 5.50 | 88.00 | 137.50 | 198.00 | 44.00 |
| 6.00 | 96.00 | 150.00 | 216.00 | 48.00 |
| 6.50 | 104.00 | 162.50 | 234.00 | 52.00 |
| 7.00 | 112.00 | 175.00 | 252.00 | 56.00 |
| 7.50 | 120.00 | 187.50 | 270.00 | 60.00 |
| 8.00 | 128.00 | 200.00 | 288.00 | 64.00 |
Significance in Industrial Applications.
A Sheets and Plates Weight Chart is important not merely for some basic computations. In fabrication units, weighing data assists in calculating machine capacity, cutting capacity as well as structural load requirements. It also enforces safety conditions and the requirements of the structure in construction projects. To the exporters and logistic providers, accurate weight estimation is very important to planning the freight, choosing the container, and costing.
Weight charts are also used to normalize supplier and buyer communication. Referring to the same chart by both parties minimizes the cases of misunderstandings concerning the amount of material and specifications, which will result in a more convenient transaction and efficient operations.
Sheet Thickness and Weight – Metric Units
| Sheet Thickness(mm) | Weight(kg/m2) |
| 1.6 | 12.6 |
| 2.0 | 15.7 |
| 2.5 | 19.6 |
| 3 | 23.6 |
| 3.2 | 25.1 |
| 4 | 31.4 |
| 5 | 39.3 |
| 6 | 47.1 |
| 8 | 62.8 |
| 10 | 78.5 |
| 12.5 | 98.1 |
| 15 | 118 |
| 20 | 157 |
| 22.5 | 177 |
| 25 | 196 |
| 30 | 236 |
| 32 | 251 |
| 35 | 275 |
| 40 | 314 |
| 45 | 353 |
| 50 | 393 |
| 55 | 432 |
| 60 | 471 |
| 65 | 510 |
| 70 | 550 |
| 75 | 589 |
| 80 | 628 |
| 90 | 707 |
| 100 | 785 |
| 110 | 864 |
| 120 | 942 |
| 130 | 1051 |
| 150 | 1178 |
| 160 | 1256 |
| 180 | 1413 |
| 200 | 1570 |
| 250 | 1963 |
The advantages of a weight chart are as follows.
It is convenient to work with a Sheets and Plates Weight Chart because it has a number of practical advantages:
- Guarantees proper quantity estimate of materials.
- Helps estimates the transport and freight costs.
- Promotes inventory and warehouse planning.
- Minimizes wastage and excessive ordering.
- Enhances the project budget and cost management.
These benefits can be attributed to the fact that weight charts are a reliable tool in industries like oil and gas, power generation, shipbuilding, automotive, and heavy engineering, among others.
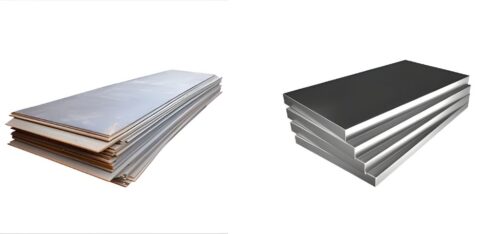
Typical Materials on the weight charts.
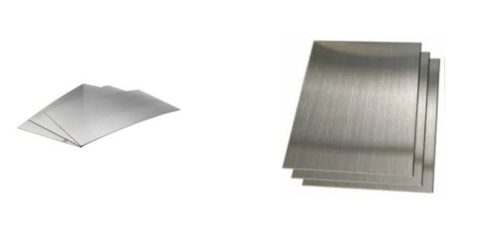
The bulk of standard weight charts include many different materials with stainless steel (304, 316, 321), carbon steel, mild steel, aluminum, copper and nickel alloys. Every material has a definite degree of density, and it has a direct effect on the end weight. As an illustration, the weight of stainless steel plates is more than that of aluminum sheets of the same dimensions, which is of significant concern when it comes to design and logistics design.
The weight charts are commonly tailored to industry-specific needs by modern suppliers, which makes them much more accurate when used in specialized uses.
Stainless Steel Plate Chemical Composition
The composition includes Carbon, Manganese, Phosphorus, Sulfur, Silicon, Nickel, Nitrogen, and 16-18% Chromium, according to the Stainless Steel Plate Manufacturers.
| Grade | C (Max) | Mn (Max) | P (Max) | S (Max) | Si (Max) | Cr | Ni | Mo | Nitrogen (Max) | Cu/ Others |
| 301 | 0.15 | 2.00 | 0.045 | 0.030 | 1.00 | 16.00 – 18.00 | 6.00 – 8.00 | – | 0.10 | – |
| 304 | 0.08 | 2.00 | 0.045 | 0.030 | 0.75 | 18.00 – 20.00 | 8.00- 10.50 | – | 0.10 | – |
| 310S | 0.08 | 2.00 | 0.045 | 0.030 | 1.50 | 24.00- 26.00 | 19.00 – 22.00 | – | – | – |
| 316 | 0.08 | 2.00 | 0.045 | 0.030 | 0.75 | 16.00 – 18.00 | 10.00 – 14.00 | 2.00 – 3.00 | 0.10 | – |
| 316L | 0.030 | 2.00 | 0.045 | 0.030 | 0.75 | 16.00 – 18.00 | 10.00 – 14.00 | 2.00 – 3.00 | 0.10 | – |
| 321 | 0.08 | 2.00 | 0.045 | 0.030 | 0.75 | 17.00 – 19.00 | 9.00 – 12.00 | – | 0.10 | Ti5 ( C + N ) Min or 0.70 max |
| 409 | 0.08 | 1.00 | 0.040 | 0.010 | 1.00 | 10.50 – 11.75 | 0.50 | – | – | Ti= 6x (C+ N ) Min or 0.70 Max |
| 410 | 0.15 | 1.00 | 0.040 | 0.030 | 1.00 | 11.50- 13.50 | 0.75 | – | – | – |
Procuring and controlling role.
In the case of procurement teams, weight charts are used as a check system when receiving materials. Actual against theoretical weight assists to find deviations so that there is quality and adherence to order requirements. Of particular relevance is in high-value materials, where even slight deviation can have an impact on performance and cost.
Also, quality control teams use weight charts to establish the dimensional accuracy and material stability to build confidence among the manufacturer and the end users.
Stainless Steel Plate Weight & Thickness Chart
Stainless Steel Plates may be customized in any thickness to meet the needs of the client; the table below shows the standard thickness of Stainless Steel Plate.
| Plate Thickness (mm) | Weight (kg/m) | kg/meter (width 1200mm) | kg/meter (width 1500mm) | kg/meter (width 1800mm) | kg/meter (width 2400mm) |
| 3 | 23.55 | 28.3 | 35.3 | 42.4 | 56.5 |
| 4 | 31.4 | 37.7 | 47.1 | 56.5 | 75.4 |
| 5 | 39.25 | 47.1 | 58.9 | 70.7 | 94.2 |
| 6 | 47.1 | 56.5 | 70.7 | 84.8 | 113 |
| 8 | 62.8 | 75.4 | 94.2 | 113 | 150.7 |
| 10 | 78.5 | 94 | 118 | 141 | 188 |
| 12 | 94.2 | 113 | 141 | 170 | 226 |
| 16 | 125.6 | 151 | 188 | 226 | 301 |
| 20 | 157 | 188 | 236 | 283 | 377 |
| 22 | 172.7 | 207 | 259 | 311 | 415 |
| 25 | 196.25 | 236 | 294 | 353 | 471 |
| 28 | 219.8 | 264 | 330 | 396 | 528 |
| 32 | 251.2 | 301 | 377 | 452 | 603 |
| 36 | 282.6 | 339 | 424 | 509 | 678 |
| 40 | 314 | 377 | 471 | 565 | 754 |
| 45 | 353.25 | 424 | 530 | 636 | 848 |
| 50 | 392.5 | 471 | 589 | 707 | 942 |
| 55 | 431.75 | 518 | 648 | 777 | 1036 |
| 60 | 471 | 565 | 707 | 848 | 1130 |
| 65 | 510 | 612 | 765 | 918 | 1224 |
| 70 | 549.5 | 659 | 824 | 989 | 1319 |
| 75 | 588.75 | 707 | 883 | 1060 | 1413 |
| 80 | 628 | 754 | 942 | 1130 | 1507 |
| 90 | 706.5 | 848 | 1060 | 1272 | 1696 |
| 100 | 785 | 942 | 1178 | 1413 | 1884 |
Conclusion
A Sheets and Plates Weight Chart is not just a reference table, it is a very important planning and decision making tool that is used in the industrial operations. Its involvement is the whole chain of supply, whether it is proper estimation of costs, effective logistics and quality assurance. Through standardized and dependable weight charts, the industries are able to make the work easier, minimize errors and maintain uniformity in projects. The industrial world of the modern era has become very competitive and therefore, learning how to use weight charts is a very important requirement to pursue perfection, consistency, and sustainability.